





1Problem+2Data+3Storytelling
From problem to decision.Clear data, well told.
I’m Diego Cayupil, a data analyst. I turn data into clear answers so teams can make better decisions.
- Santiago, Chile
- Open to remote work
- English and Spanish
- SQL
- BigQuery
- Power BI
- Python
- Excel
- Tableau
- Snowflake
- dbt
- Git
- Claude
Why did on-time delivery fall?
OTIF: orders delivered on time and in full · 3 warehouses
The North warehouse explains 70% of the drop.
1Check its stock-outs this week
Where does it hurt?That’s where I start.
Four pains. Pick yours.
Errors nobody sees.
5 questions to the data before the first chart
primary key · orphan rows · ranges · reconciliationI test the data before charting it.
Every number, with its proof.
14 charts, no conclusion.
I keep only what answers the decision.
The conclusion on top, then the next step.
The report arrives old.
I connect the sources and automate the load.
Those 3 days now go to analysis.
Same question, three answers.
Net sales = invoiced − credit notes
With a description, for people and AII define each metric once and test the AI.
The AI gives the dashboard’s number.
It all starts with defining.The rest is the result.
The same six phases make AI answer right.
- DefineMost importantProblem framing↗
- ReviewData quality↗
- ModelData modelling↗
- AnalyzeInsights↗
- CommunicateStorytelling + UX↗
- DocumentDocumentation + AI↗
“I need a dashboard”is not a problem.
“I need a delivery dashboard, with everything.”
“Which warehouse do I fix first?”
I don’t build on dataI haven’t tested.
“The data is fine, trust me.”
2 definitionsof “on time”: 94.1% and 92.4%. The customer’s wins.
One number,one single version.
94.1 · 96.0 · 92.4Three figures for the same OTIF
92.4%One measure. Everyone reads the same
I don’t show you data.I tell you what to do.
“OTIF fell 1.1 points.”
“The North warehouse explains 70%. Check it first.”
If it needs explaining,it isn’t ready yet.
8 pages, 60 visuals, no conclusion.
One page. The title already states the conclusion.
If it isn’t written down,it doesn’t exist.
A finished dashboard only I understand.
Every metric with its card, in Git and in the model.
I use AI every day.I never trust it blind.
This is how I build every Power BI project.
Define
Which warehouse do I fix first?
The business question
Builds
OTIF % = DIVIDE(
  [OTIF orders],
  [Orders] )
The SQL in BigQuery and the DAX measures
Check
Every number against the source
Decide
What the dashboard says
✕ Never write access · personal data in a chat · a number without its source
One complete case.Nine on the way.
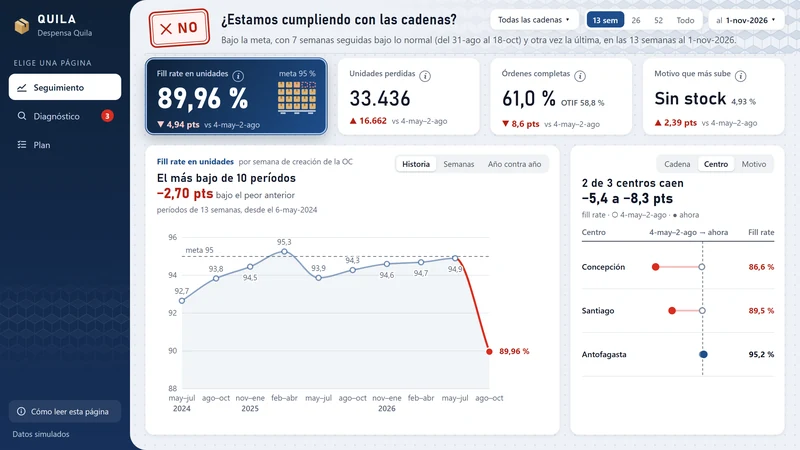
Fill rate to the chains fell from 95% to 88%. Where is it lost?
From the first meeting to the plan: seven steps, with the live dashboard.
The Cyber promotions: did they make money, or just move sales from one week to another?Coming soon
They buy once and never come back. Which categories bring customers who do return?Coming soon
What problemdo you want to solve?
Tell me in your own words, even if you don’t know what data you have. I reply within one business day.