




HomeAboutProjectsHow I workContact
Projects

Business cases,end to end.

The first one is complete. The rest are on the way.

Simulated data and fictional companies.

Case 01 · Operations · simulated data

Fill rate to the chains fell from 95% to 88%. Where is it lost?

  1. Part 1 · Starting from zero
  2. Part 2 · The drop
The case, before step 1

Four chains, one number nobody measured.

Who
Despensa Quila, a (fictional) grocery maker that ships to four supermarket chains.
The ask
“Each chain complains with its own number. I need one number for all four.”
What’s at stake
The agreements with the chains require a 95% fill rate. Months later, it drops to 88%.
● Live · try it
Part 1 · step 1 of 7 · Define

One number for all four chains.

  1. 1✗ The problemEach chain complained with its own number: the same quarter came out at 95%, 90% or 59%.
  2. 2What I didI agreed what delivering means: what the chain receives in full and on time, in units.
  3. 3✓ The resultOne definition and one target: fill rate in units, 95%.
1The same quarter, depending on how it was counted
95%90%59%
What we agreed2Fill rate = units received in full and on time ÷ units ordered
3
  • ✓ what the chain receives
  • ✓ in full and on time
  • ✓ in units
  • ✓ 95% target
Part 1 · step 2 of 7 · Review

Five errors, fixed at the source.

  1. 1✗ The problemThree systems nobody had joined: 71 days didn’t match.
  2. 2What I didFive quality issues, each with its count and its SQL fix.
  3. 3✓ The result32,760 of 32,760 days match: the data can be trusted.
2
  1. ✕ 57lines duplicated by a resendSELECT DISTINCT✓
  2. ✕ 14lines in cases, not units× 12✓
  3. ✕ 9lowercase SKUs, no masterupper(sku)✓
  4. ✕ 6orders with no delivery datein transit✓
  5. ✕ 11negative stock closingsset to 0, flagged✓
Reconciliation · stock shipments = order lines, day by day
1Raw
71 days off
Clean3
32,760 of 32,760 ✓
Part 1 · step 3 of 7 · Model

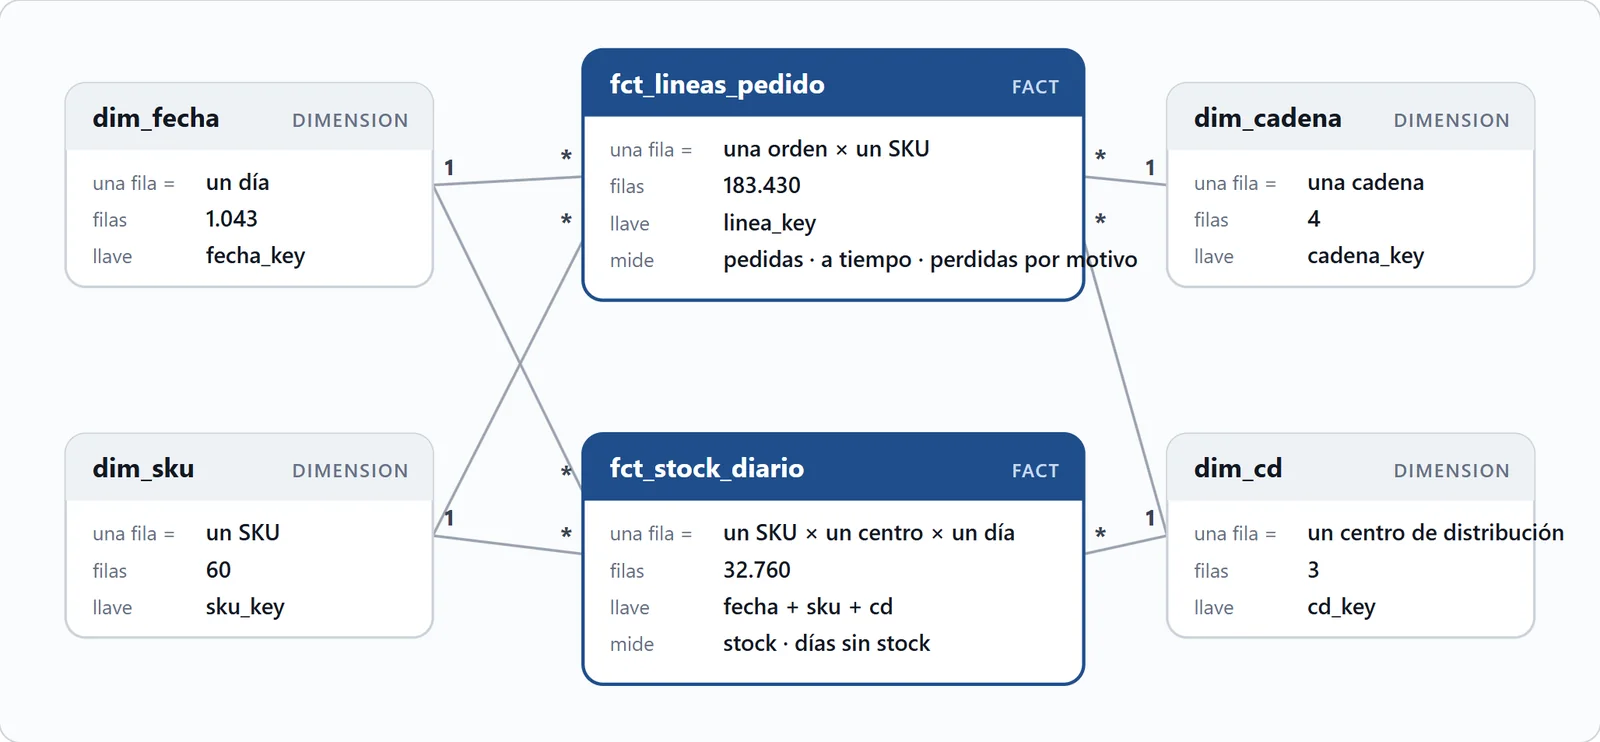
Every unit ordered lands in exactly one column.

  1. 1✗ The problemStock lives at SKU × center × day: attached to the orders, it repeated on every order.
  2. 2What I didA galaxy schema: two fact tables sharing date, SKU and center.
  3. 3✓ The resultOne simple measure: DIVIDE([A tiempo], [Pedidas]), no logic in DAX.
123
Part 1 · step 4 of 7 · Communicate

Weekly, against the target and against normal.

  1. 1✗ The problemThere was no report at all: nobody could see whether they delivered.
  2. 2What I didI tried year, quarter, month, week and day: weekly matches the Monday meeting.
  3. 3✓ The resultA dashboard that answers itself: the question on top, the answer below.
23
Part 2 · step 5 of 7 · Define

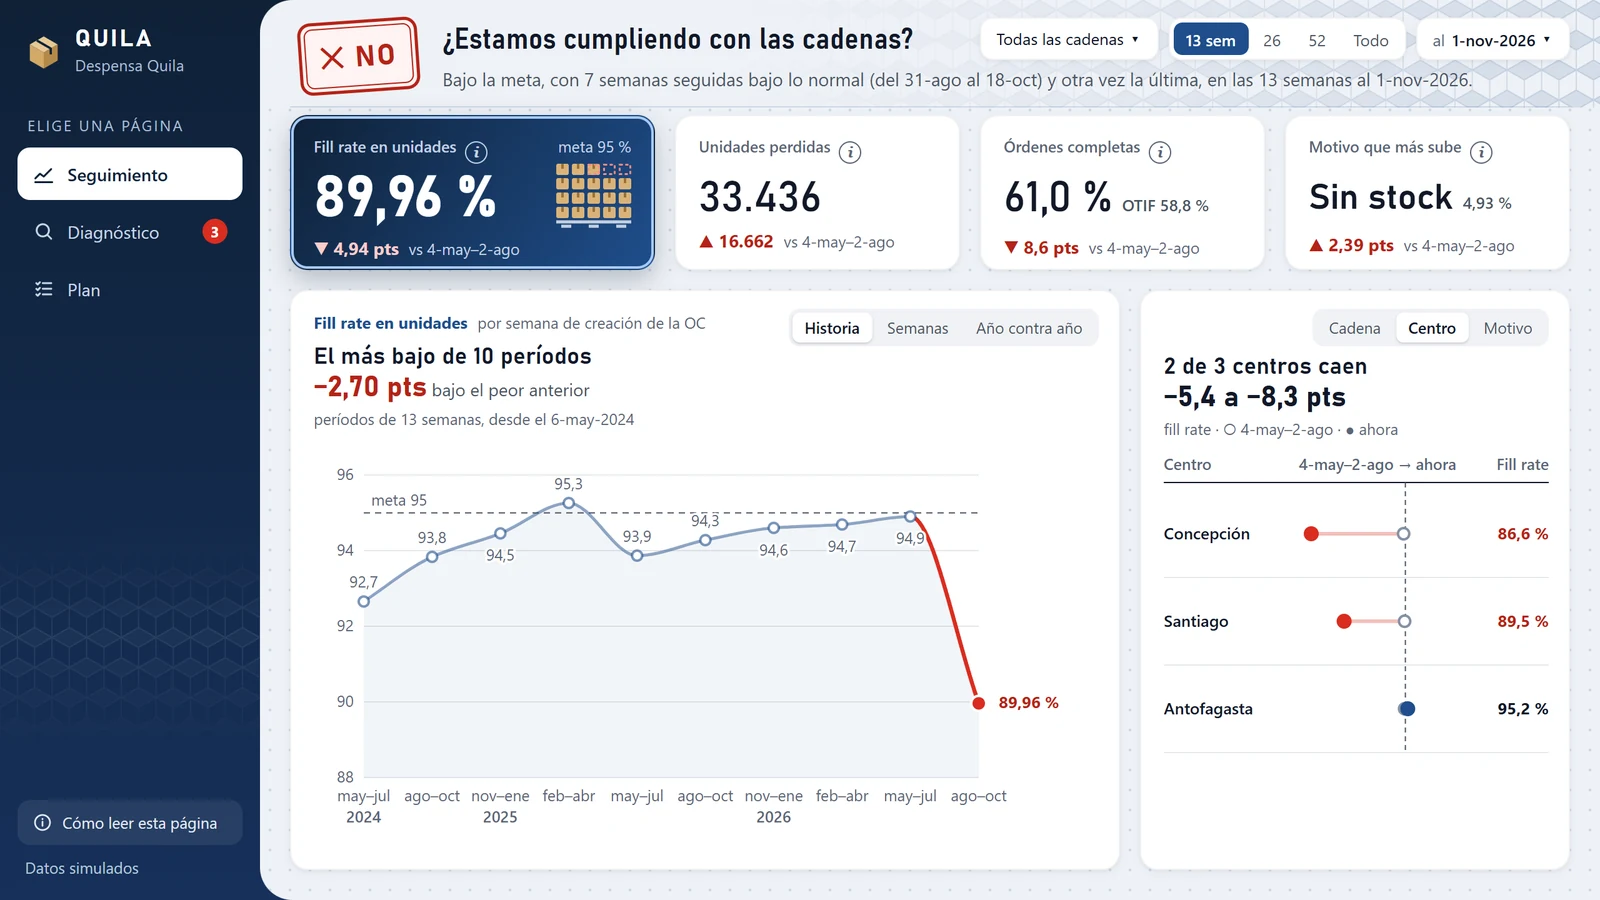
The real drop is 4.94 points, not 7.

  1. 1✗ The problem“It fell from 95% to 88%”: but the 88% was a single week.
  2. 2What I didI compared 13 weeks against 13, with clean data.
  3. 3✓ The result94.90% → 89.96%: −4.94 pts. Now we can look for where.
1✕ What was said95% → 88%−7 ptsthe 88% was a single week
3✓ What the data says94.90% → 89.96%−4.94 pts13 weeks against 13, with clean data
What needs decidingWhat to fix firstHow much to promise each chainBefore December
Part 2 · step 6 of 7 · Analyze

It isn’t one problem: it’s three.

  1. 1✗ The problemThree suspects: missing stock, slow shipping in Concepción, or an allocation rule hurting one chain?
  2. 2What I didI tested five hypotheses: the drop is real (19 times normal) and I ruled out two.
  3. 3✓ The resultThree causes, in three places: −2.43 · −2.19 · −1.03 pts.
38 SKUs out of stock in Santiagosince Aug 3−2.43Concepción ships latesince Aug 13−2.19Canelo rejects at the docksince Sep 2−1.03Background noisenot an improvement+0.70Real drop94.90% → 89.96%−4.940−2−4−6

Ruled out ✕ the allocation rule ✕ the order mix

Part 2 · step 7 of 7 · Communicate

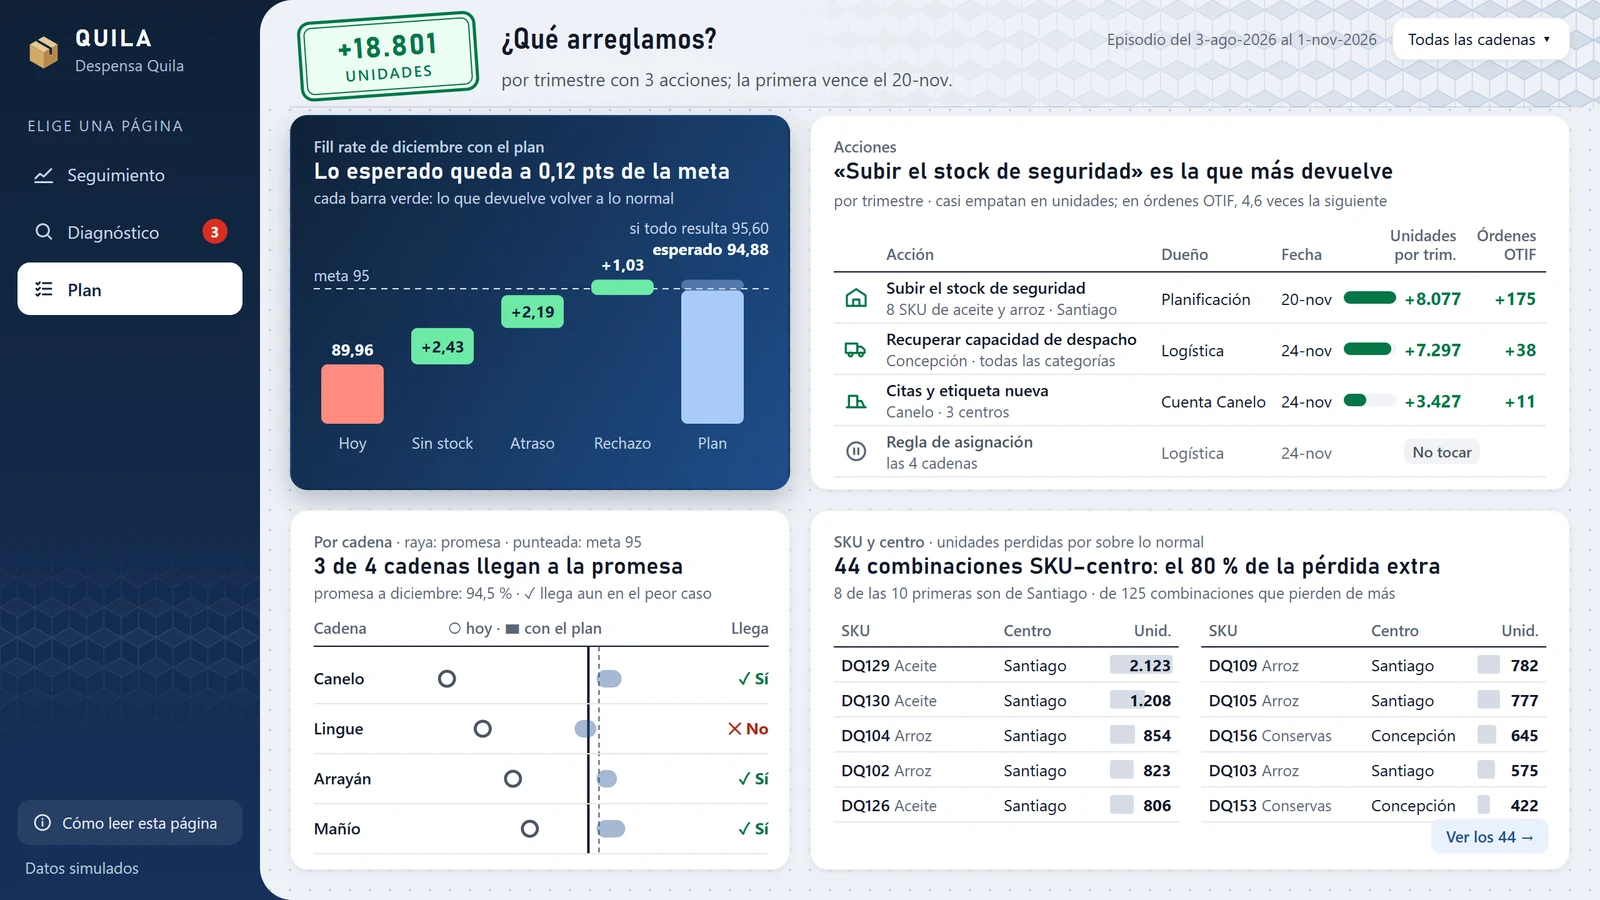
Promise 94.5% for December, not 95.

  1. 1✗ The problemEven fixing everything, December landed between 94.88% and 95.60%: the target, on the edge.
  2. 2What I didThree actions, with owner and date: stock, shipping and Canelo’s dock slots.
  3. 3✓ The result+18,801 units per quarter and a promise we can keep: 94.5%.
123
03Coming soon

9 more cases,on the way.

Consumer goodsBeverage margin fell 3 points in October and nobody knows why.Coming soon
RetailStock-outs are costing us sales, but I don’t know in which stores or how much.Coming soon
AirlineOn-time performance fell in November. Which routes, and why?Coming soon
MarketplaceSeller sales keep growing, but margin per order is falling.Coming soon
Consumer goodsThe chain’s forecast is off by 30% in snacks. Where, and why?Coming soon
RetailThe Cyber promotions: did they make money, or just move sales from one week to another?Coming soon
AirlineWe cut prices and load factor didn’t go up. On which routes did it fail?Coming soon
Retail bankingDelinquency on new credit cards is rising. Which cohorts?Coming soon
MarketplaceThey buy once and never come back. Which categories bring customers who do return?Coming soon
Community challengesOnyx DataDNA challengesComing soon

What problemdo you want to solve?

Tell me in your own words, even if you don’t know what data you have. I reply within one business day.

To start, this is all I need
01What hurtsIn your own words, no jargon.
02Who it hurtsWho suffers it and who decides.
03What you’d decideIf you had the answer tomorrow.
diego.cayupil2@gmail.comLinkedIn ↗It’s 10:42 · UTC−3